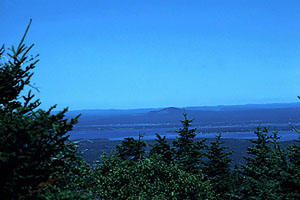
Acadia |
||||||||||||||||||||||||||||||||||||||||||||
|---|---|---|---|---|---|---|---|---|---|---|---|---|---|---|---|---|---|---|---|---|---|---|---|---|---|---|---|---|---|---|---|---|---|---|---|---|---|---|---|---|---|---|---|---|
| Best 5% |
51K JPEG | 85K JPEG | ||||||||||||||||||||||||||||||||||||||||||
| Park Average |
51K JPEG | 77K JPEG | ||||||||||||||||||||||||||||||||||||||||||
| Worse 5% |
43K JPEG | 77K JPEG | ||||||||||||||||||||||||||||||||||||||||||
| Composite Image | 51K JPEG | |||||||||||||||||||||||||||||||||||||||||||
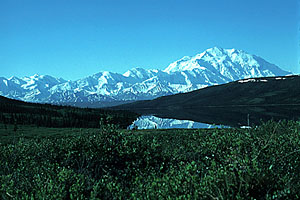
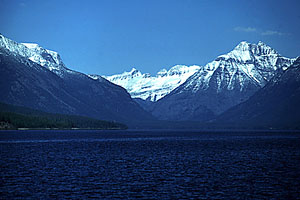
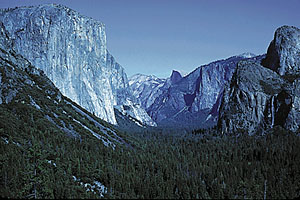
Welcome to our gallery of visibility images. These images have been provided by the National Park Service Air Quality Office.
Each of the scenes below is from a US national park. For each scene we have provided three images which illustrate a range of visual air quality conditions. These images demonstrate conditions that are representative of what you would expect on the best 5% of days, at average visibilty, and on the worse 5% of days. We offer two sizes of each image from which to choose or a smaller composite image of all three. Each image will open in a separate browser window for easy comparison.

Acadia |
||||||||||||||||||||||||||||||||||||||||||||
|---|---|---|---|---|---|---|---|---|---|---|---|---|---|---|---|---|---|---|---|---|---|---|---|---|---|---|---|---|---|---|---|---|---|---|---|---|---|---|---|---|---|---|---|---|
| Best 5% |
51K JPEG | 85K JPEG | ||||||||||||||||||||||||||||||||||||||||||
| Park Average |
51K JPEG | 77K JPEG | ||||||||||||||||||||||||||||||||||||||||||
| Worse 5% |
43K JPEG | 77K JPEG | ||||||||||||||||||||||||||||||||||||||||||
| Composite Image | 51K JPEG | |||||||||||||||||||||||||||||||||||||||||||

Denali |
||||||||||||||||||||||||||||||||||||||||||||
|---|---|---|---|---|---|---|---|---|---|---|---|---|---|---|---|---|---|---|---|---|---|---|---|---|---|---|---|---|---|---|---|---|---|---|---|---|---|---|---|---|---|---|---|---|
| Best 5% |
68K JPEG | 128K JPEG | ||||||||||||||||||||||||||||||||||||||||||
| Park Average |
77K JPEG | 136K JPEG | ||||||||||||||||||||||||||||||||||||||||||
| Worse 5% |
51K JPEG | 85K JPEG | ||||||||||||||||||||||||||||||||||||||||||
| Composite Image | 51K JPEG | |||||||||||||||||||||||||||||||||||||||||||

Glacier |
||||||||||||||||||||||||||||||||||||||||||||
|---|---|---|---|---|---|---|---|---|---|---|---|---|---|---|---|---|---|---|---|---|---|---|---|---|---|---|---|---|---|---|---|---|---|---|---|---|---|---|---|---|---|---|---|---|
| Best 5% |
60K JPEG | 111K JPEG | ||||||||||||||||||||||||||||||||||||||||||
| Park Average |
60K JPEG | 102K JPEG | ||||||||||||||||||||||||||||||||||||||||||
| Worse 5% |
51K JPEG | 94K JPEG | ||||||||||||||||||||||||||||||||||||||||||
| Composite Image | 51K JPEG | |||||||||||||||||||||||||||||||||||||||||||

Yosemite |
||||||||||||||||||||||||||||||||||||||||||||
|---|---|---|---|---|---|---|---|---|---|---|---|---|---|---|---|---|---|---|---|---|---|---|---|---|---|---|---|---|---|---|---|---|---|---|---|---|---|---|---|---|---|---|---|---|
| Best 5% |
85K JPEG | 153K JPEG | ||||||||||||||||||||||||||||||||||||||||||
| Park Average |
85K JPEG | 136K JPEG | ||||||||||||||||||||||||||||||||||||||||||
| Worse 5% |
77K JPEG | 145K JPEG | ||||||||||||||||||||||||||||||||||||||||||
| Composite Image | 60K JPEG | |||||||||||||||||||||||||||||||||||||||||||
 The Shodor
Education Foundation, Inc.